Solar Panel Array
An array of solar panels was installed on the Library’s roof during the Fall of 2009, to help supply electricity for the building. All of the funding for the project came from State and Federal grants, and rebates from the energy company. Click the tabs below to learn about our system and see how much energy it is producing. Also look for books about solar energy in our catalog to learn more about alternative energy sources.
Energy Performance
Installation Profile
| Array Azimuth | Array Tilt | Capacity |
| 8.82 | ||
| 240° | 10° | Kilowatts (DC) |
Hardware Components
| Module Type | Module Wdc | Quantity | Total Capacity (KWdc) |
|---|---|---|---|
| Kyocera Solar KD210GX | 210 | 42 | 8.820 |
| Inverter Type | Inverter Wac | Quantity | Total Capacity (KWac) |
|---|---|---|---|
| SMA America Sunny Boy 7000 | 7000 | 1 | 7.000 |
| SMA America Sunny Boy 4000 | 4000 | 1 | 4.000 |
System Specifics
How It Works
Photovoltaic (PV) Modules 1 are composed of silicon semiconductors similar to those used in computer chips. When sunlight strikes the PV modules, it knocks electrons loose from their atoms, which allows them to flow through the modules and into the PV Circuit Conductors 2. This flow of electrons, or electricity, is referred to as Direct Current (DC) Power. Once the electricity leaves the modules, it moves through the DC Disconnect 3 and into the DC/AC Inverter 4. The role of the DC/AC Inverter is to convert DC Power into Alternating Current (AC) Power. Once converted, AC Power exits the DC/AC Inverter through the AC Circuit Conductors 5 and into the AC Disconnect 6. Next the AC Power enters the AC Production Meter 7. The AC Production Meter records the amount of power produced over the lifespan of the system as Kilowatt Hours (kWh). Once recorded, the AC Power travels into the library’s Electrical Panel 8 where it is distributed to the library’s electrical loads. If more power is being produced from the system than is being consumed in the library, the excess power flows out to the Utility Electric Meter 9 causing the meter to “spin backwards,” crediting the library’s electrical usage. The power then continues on to the Utility Electric Grid where it is distributed to other customers.
Savings Analysis
Our solar PV system’s total cost was $67,163. $37,926 was covered through a grant from Massachusetts Technology Collaborative, and $29,237 came from the National Grid Clean Energy Choice. These two sources covered 100% of the cost of the system, so the Town spent zero dollars on the project.
The estimated cost savings per year is $1,352. Annual and lifetime cost savings are dependant on the inflation in electricity prices over time, which are detailed below.
| Annual Inflation Rate |
Avg. Annual Savings |
Total Savings Over 25 years |
| 2.50% | $1,730 | $43,239 |
| 5.00% | $2,402 | $60,052 |
| 7.50% | $3,402 | $85,060 |
| 10.00% | $4,898 | $122,456 |

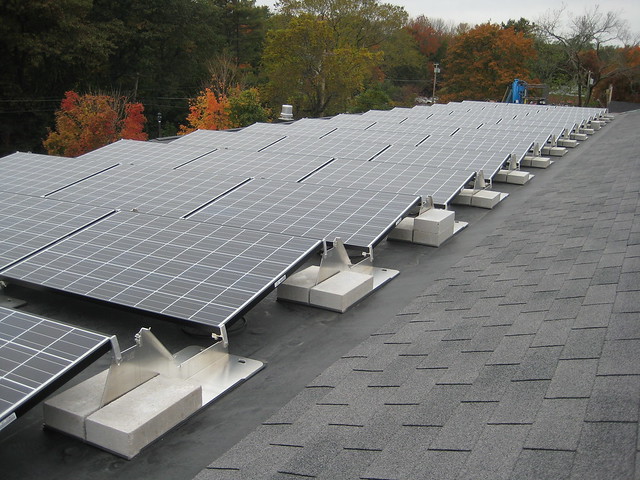
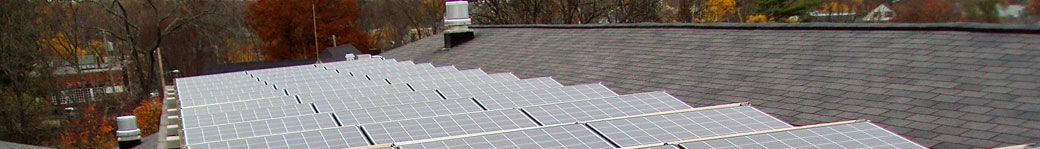
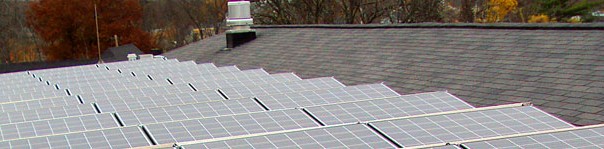
Installation Photos